Are you curious about how iPhone and Android stack up against each other? Whether you’re thinking about switching phones or just want to know which platform leads in popularity, performance, and user satisfaction, these statistics will give you clear answers.
Knowing the facts behind iPhone vs Android can help you make smarter choices for your next phone. Keep reading to discover surprising numbers that could change the way you see your device and your daily tech life.
Market Share Comparison
The market share comparison between iPhone and Android shows clear differences. Each platform has millions of users worldwide. Understanding these differences helps see which system leads in sales and popularity.
Market share reflects how many people use each type of phone. It changes with new phone releases and user preferences. Let’s explore the key facts behind these numbers.
Global Sales Figures
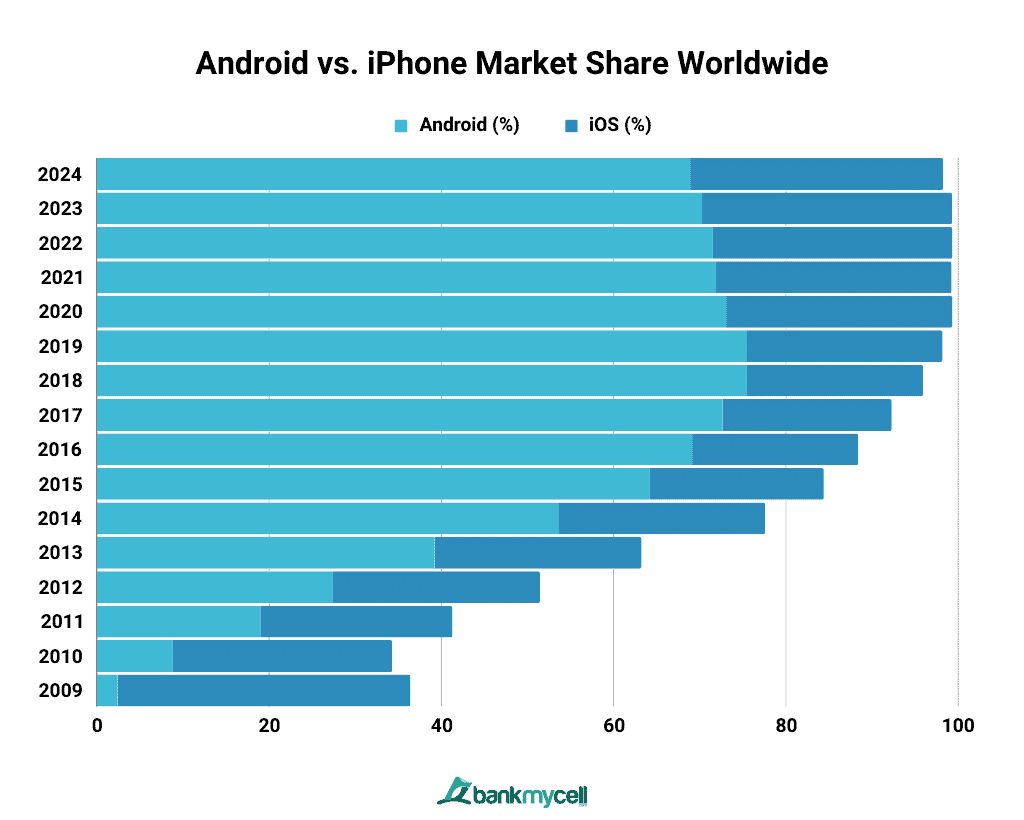
Android holds the largest share of global smartphone sales. It covers over 70% of the market. iPhone sales make up about 25% worldwide. Android’s variety of brands helps it reach more buyers. Apple sells fewer models but earns high revenue per device.
Regional Preferences
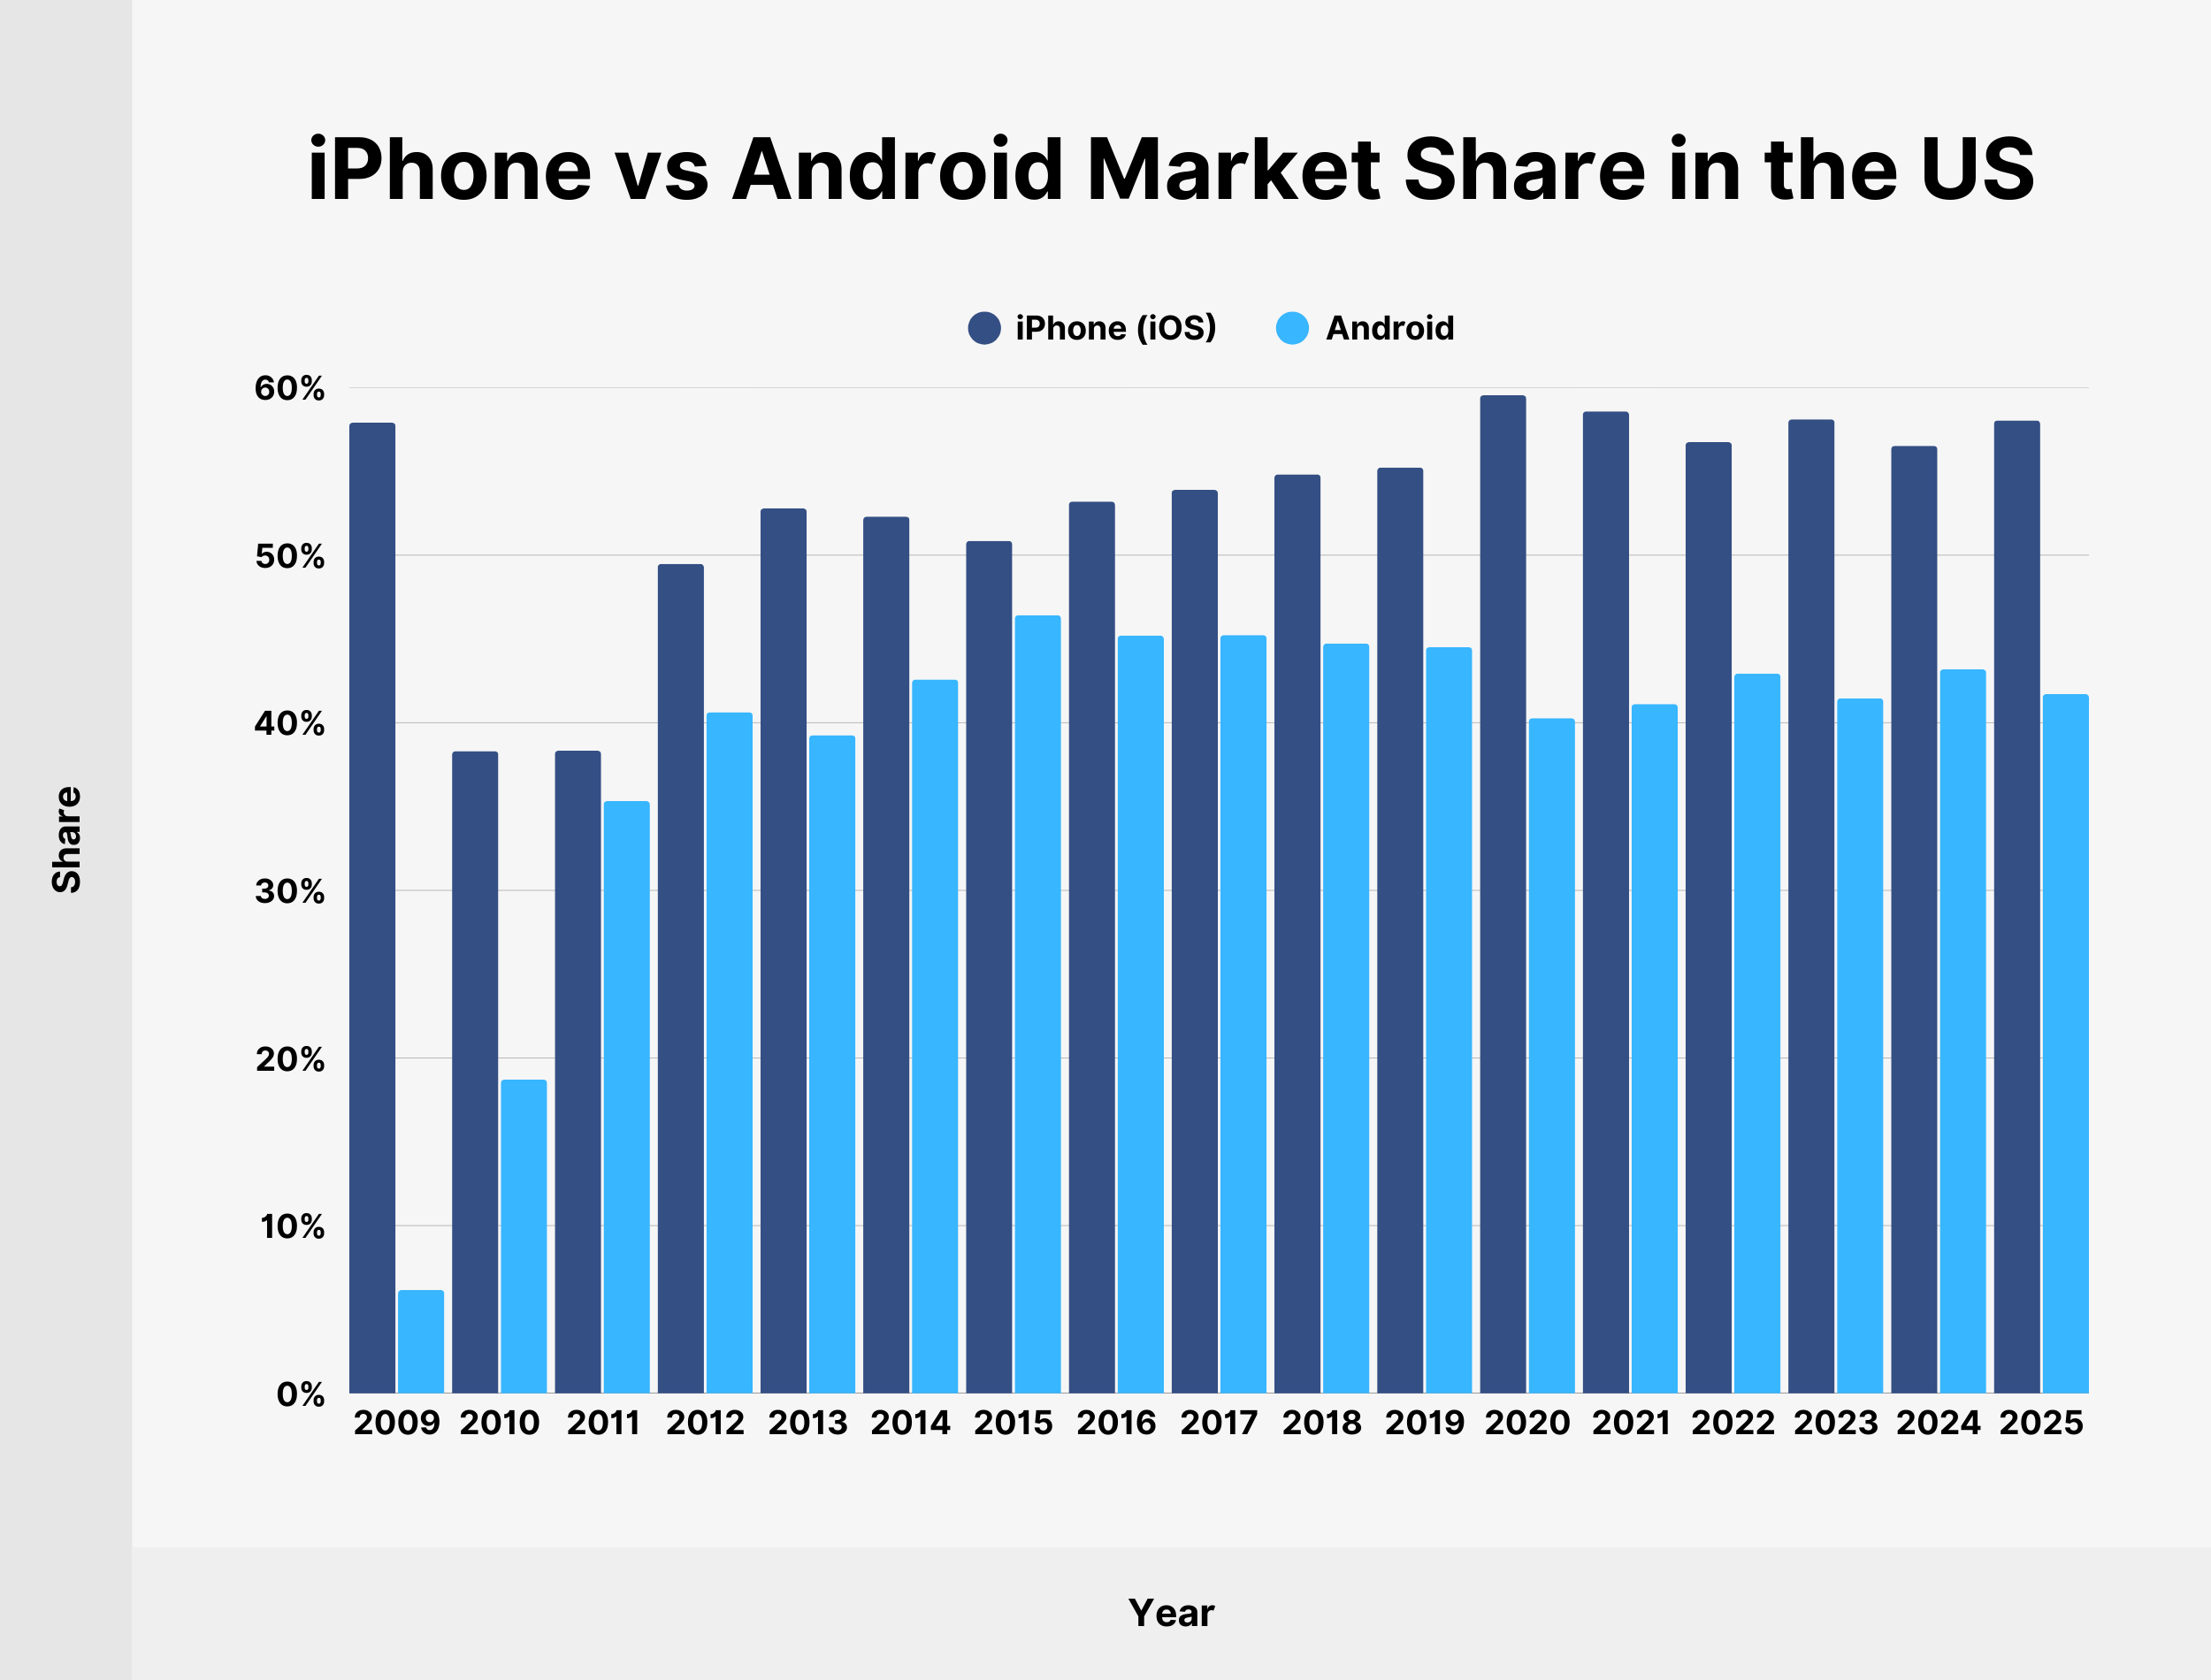
iPhone is very popular in North America and parts of Europe. Users there prefer Apple’s design and ecosystem. Android dominates in Asia, Africa, and South America. Many brands use Android, offering phones at low prices. Local markets often choose Android due to affordability.
Growth Trends Over Time
Android has grown rapidly over the last decade. More brands and models keep entering the market. iPhone sales grow steadily but slower than Android’s. Apple focuses on premium devices and loyal customers. Android’s growth shows demand for diverse phone options.
Credit: www.bankmycell.com
User Demographics
User demographics reveal who prefers iPhone or Android devices. They show differences in age, gender, income, and how people use their phones. Understanding these details helps explain why some choose one platform over the other. It also shows trends in smartphone usage across the world.
Age And Gender Breakdown
Young adults tend to favor iPhones more than Android phones. The age group from 18 to 34 shows a higher percentage of iPhone users. Older adults, especially over 45, lean more toward Android devices. Both platforms have a fairly balanced gender split. Slightly more men use Android, while women slightly prefer iPhones.
Income Levels
iPhone users generally have higher income levels. Many earn above the national average and spend more on technology. Android users come from diverse income groups. They include both budget-conscious buyers and high earners. Android offers a wide range of prices, making it accessible to many.
Usage Patterns
iPhone users spend more time on apps related to social media and entertainment. Android users often use their phones for communication and productivity. Both groups show strong interest in gaming, but Android leads in downloads. iPhone users typically update their devices more frequently than Android users.
App Store Performance
The performance of app stores is a key factor in the iPhone vs Android debate. Both platforms offer millions of apps, but they differ in availability, revenue, and popular categories. Understanding these differences helps users choose the best device for their needs.
Number Of Apps Available
The Apple App Store has around 2.2 million apps. Google Play Store offers more, with about 3.5 million apps. Android’s open system allows more apps but also more low-quality ones. Apple’s strict review process keeps many apps high quality.
Revenue Generation
The App Store earns more revenue than Google Play. iPhone users tend to spend more on apps and in-app purchases. Developers often prefer iOS for better earnings. Android has more users but less spending per user.
Popular Categories
Games dominate both stores. Social media and entertainment apps are also very popular. Health and fitness apps grow fast on both platforms. Productivity tools have strong demand among iPhone users.
Device Performance Metrics
Device performance is a key factor in choosing between iPhone and Android. It affects daily use and overall satisfaction. Important metrics include battery life, processing speed, and camera quality. These stats help users decide which device suits their needs better.
Battery Life Comparison
Battery life varies widely between iPhone and Android models. Android phones often have larger batteries. They sometimes last longer on a single charge. iPhones use efficient software to save power. Both brands offer fast charging and wireless options. Real usage shows Android may last a bit longer for heavy tasks. iPhones perform well with moderate use.
Processing Speeds
iPhones use custom chips designed by Apple. These chips score high in speed tests. Android devices use a range of processors from different makers. High-end Android phones can match or exceed iPhone speeds. Speed impacts app loading and multitasking. iPhones tend to stay fast over time. Some Android phones slow down with heavy use.
Camera Quality Stats
Both iPhone and Android cameras produce sharp photos. iPhones often focus on color accuracy and natural tones. Android cameras may offer more features and customization. Megapixel counts vary, but higher numbers don’t always mean better photos. Low light performance is strong on both sides. Video quality is excellent on recent models from both brands.
Customer Satisfaction Rates
Customer satisfaction rates show how happy users are with their phones. These rates help us see which platform meets users’ needs better. Both iPhone and Android have millions of users worldwide. Each group has different reasons for their satisfaction or dissatisfaction.
Examining these rates reveals patterns in user loyalty, common complaints, and how often people upgrade their phones. These insights guide new buyers and help brands improve their products.
Brand Loyalty
iPhone users show very high brand loyalty. Many stay with Apple for years. This loyalty comes from easy-to-use features and consistent updates. Android users are less loyal overall. They often switch between different brands. This happens because Android phones vary in price and features. Brand loyalty depends on user experience and satisfaction.
Common Complaints
iPhone users often complain about the high price. Some find iOS too limiting. Android users mention software updates as a common issue. Many Android phones get fewer updates than iPhones. Battery life and app compatibility also cause complaints on both sides. These issues affect how satisfied users feel.
Upgrade Frequency
iPhone users tend to upgrade their phones more often. Many buy new models every one to two years. Android users upgrade less frequently on average. They keep their phones longer, often three years or more. Upgrade frequency depends on budget and phone durability. This pattern affects overall satisfaction rates.
Security And Privacy Insights
Security and privacy remain top concerns for smartphone users. Both iPhone and Android devices offer strong protection, but they differ in key areas. Understanding these differences helps users pick the right phone for their needs.
This section explores data breach incidents, user trust levels, and security features for both platforms. Clear facts and stats reveal how each handles user safety and privacy.
Data Breach Incidents
Data breaches affect millions of users every year. Android devices report more data breach incidents than iPhones. The open nature of Android allows more apps, but increases risk. Apple controls its app store tightly, reducing chances of harmful apps. Still, no system is fully safe from breaches.
User Trust Levels
Users tend to trust iPhones more with personal data. Studies show iPhone users feel safer sharing sensitive information. Android users express more concern about app permissions and data leaks. Trust grows from consistent security updates and transparency. Apple’s strict privacy policies boost user confidence.
Security Features
Both platforms use strong security features to protect users. iPhones include hardware-based encryption and Face ID technology. Android phones offer fingerprint sensors and Google Play Protect. Regular security patches keep both devices updated. Apple’s closed system limits app risks. Android’s flexibility can expose users to more threats.
Pricing And Affordability
Price plays a big role in choosing between iPhone and Android devices. Many buyers want to get the best phone without spending too much. Comparing costs helps find the right fit for each budget.
Both iPhone and Android phones come in many price ranges. The cost depends on the brand, model, and features. Some phones are made for luxury buyers. Others target those who want simple, affordable devices.
Average Device Costs
The average price for an iPhone is higher than most Android phones. New iPhones often start above $700. Android phones range widely, from $100 to over $1,000. This variety lets buyers choose phones that match their wallet.
Carrier Subsidies
Carriers often offer discounts or payment plans. These deals lower the upfront cost of phones. Both iPhone and Android users can benefit. Subsidies make expensive phones easier to buy over time.
Cost Versus Features
High price does not always mean better features. Some Android phones offer premium specs at lower prices. iPhones focus on smooth user experience and build quality. Buyers must weigh features against the price carefully.
Credit: futuredrafted.medium.com
Credit: backlinko.com
Frequently Asked Questions
Which Smartphone Has The Largest Global Market Share?
Android holds the largest global market share due to diverse manufacturers. IPhone has a smaller, but loyal user base worldwide. Android dominates emerging markets, while iPhone leads in premium segments. Both platforms have strong user communities and steady growth trends.
How Do Iphone And Android User Demographics Differ?
IPhone users are often younger and have higher income levels. Android users represent a broader demographic with varied income and age groups. Geographic preferences also differ, with iPhone popular in North America and Android dominating Asia and Africa.
What Are The Key Differences In App Usage Statistics?
IPhone users tend to spend more on apps and in-app purchases. Android users download more free apps, reflecting platform diversity. Both platforms show high engagement in social media, gaming, and productivity apps, with subtle usage pattern differences.
How Does User Satisfaction Compare Between Iphone And Android?
IPhone users report higher satisfaction due to seamless integration and user experience. Android satisfaction varies by manufacturer and model quality. Both platforms improve regularly, but iPhone consistently scores better in customer loyalty and satisfaction surveys.
Conclusion
Both iPhone and Android have strong user bases worldwide. Each offers unique features that attract different users. Android leads in variety and price options. IPhone stands out with seamless updates and design. Choosing depends on what matters most to you.
Consider ease of use, apps, and budget carefully. Your perfect phone matches your lifestyle and needs. Technology changes fast, so stay open to new trends. The best choice fits your daily habits and preferences.